if trading is 100% then technical analysis how much?

today. and only about technical analysis, it also has a lot of difficulties, but today we only have charts and support and resistance
Known about
In the above given Costas has written 25% technical analysis but did not write anything about it?
Q's technical analysis brings a lot of wear and tear.
The chart types are as follows:
- Line chart
- Bar chart
- Japanese Candlestick
- Heikin Ashi
Now according to the name of the chart given above, the following charts have been given to me, it seems that I will understand you by looking at you.
Line chart

Stock in Only the last price of (closing price) is shown.
Bar chart
The stock price in the bar chart (open price) is the top price of the dayThe lowest price of the day and the closing price are shown. Now know about the most famous chart of the world
Japanese Candlestick
It would be good to know the history of Japanese candlestick before proceeding. You may have come to know from the name that the origin of the candlestick will be in Japan. It was first used in the 18th century by a rice merchant in Japan. Although it has been used for a long time in Japan to poison prices, Western countries did not know anything about it in some countries. It is believed that in 1980 a vapor named Steve Nishan found it and then told the world how to use it and how it works. He also wrote a book on it named Hagee's "Japanese Candlestick Charting Techniques". Still, this book and A Chart are very popular. Chart given

Here the chart also shows the open price of the stock as a bar chart, the top price of the day (high price) and the low price of the day, and the closing price.
Heikin Ashi

A chart also shows the open price of the stock like the Japanese candlestick, the top price of the day (high price) and the low price of the day, and the closing price. So you can get the idea in your mind that what is the benefit of the S chart, so what is the benefit of the sound that is right, now what is the meaning of right, if the price of the stock is going upwards then unless Turning towards Nicea, the color of Kandel will remain the same till you look at the chart from the grain.
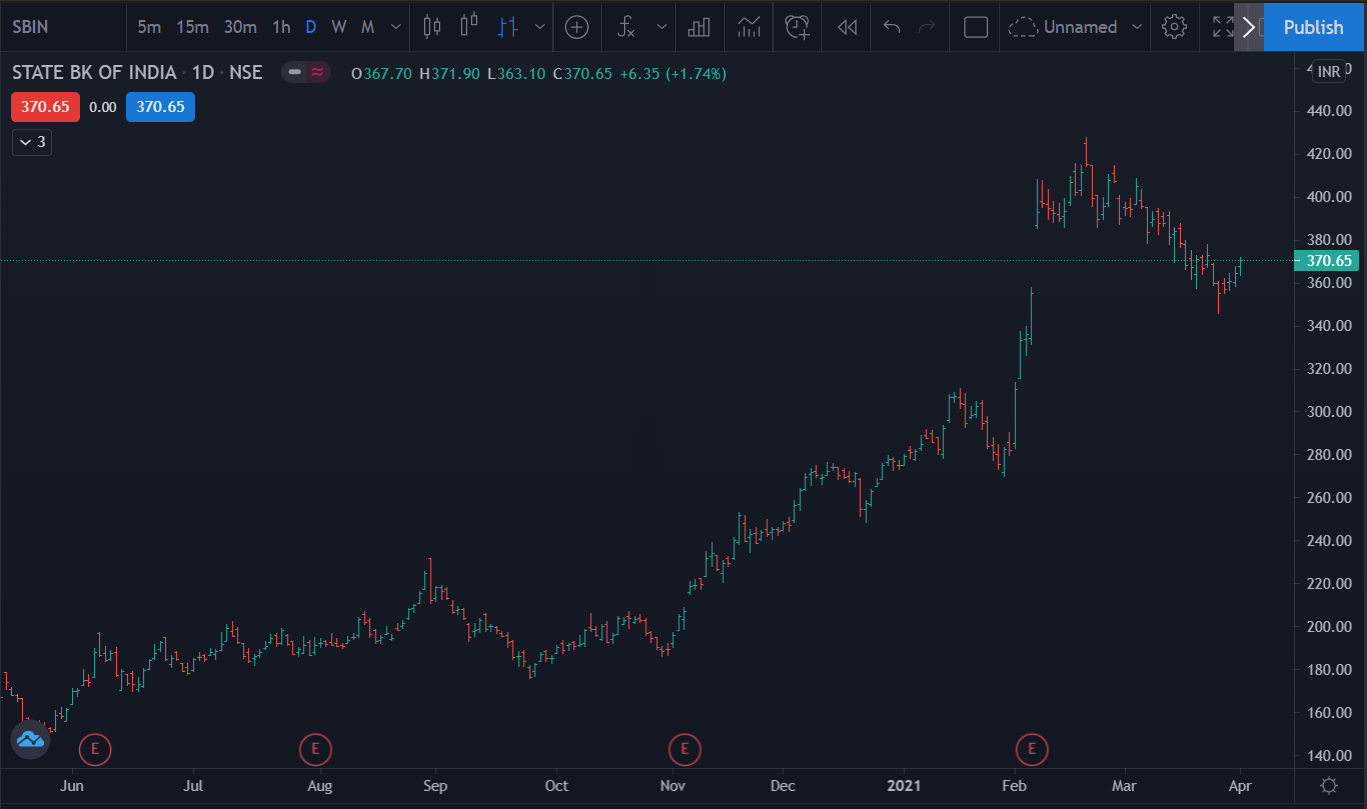
Support & Resistance
Now let me tell you what is the support and resistance through the chart, from the 2 to 3 chart support towards the 2 to 3 chart resistance


A lot of people will have questions about how many times the Horizontal line will touch the stock price when we make the Regions of Spot, then the Horizontal line will be correct if less than 3 to 4 times less.
And when the support is broken, then the same suppository acts like resistance and when the resistance is broken, the same regiment acts like a suppository.
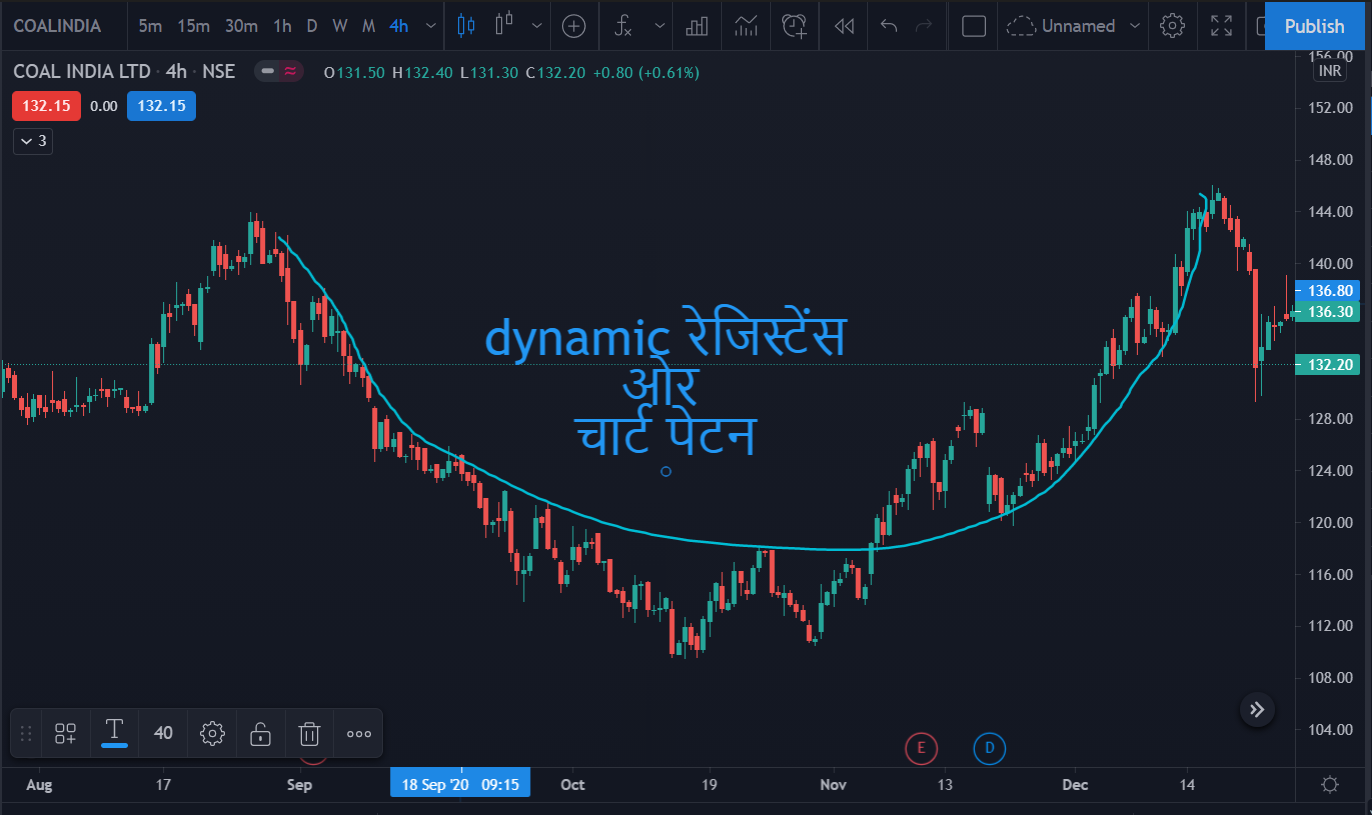
And technical analysis, Volume, moving average, indicator, Fibonacci retracements which are quite interesting and also very happy
I will post slowly through blogs
Comments
Post a Comment