
Know about some chart patterns.
First of all, understand what are chart patterns? And how it's made? A chart pattern is a pattern that shows the price of a stock and is formed by a buyer's and a seller's behavior.
Today we will learn about the double bottom, double top, head and shoulders, inverted head and shoulders, flag and pole, and inverted flag and pole.
Double Bottom
A chart pattern with A is formed in A chart pattern when the market signals an uptrend after ending the downtrend.
In a pattern, the stock price takes support from one place and then after some time again takes support from the same place or around the same support, the same 2 support is called the double bottom. You will understand by looking at the chart. If you don't know how to trade (uptrend, downtrend, or sideways) 👉Click here

Now you must be thinking that the double bottom chart pattern is fine, but how to trade in it, then one has to look carefully for it.

The yellow line is called the neckline and in this chart pattern, the trade is to be done only after the neckline course and the closing of the candle is necessary only then you can enter the trade.
Double Top
In A chart pattern: A chart pattern is formed when the market shows signs of going down after closing the trade.
In a pattern, the stock price is taken resistant from one place and then again takes resistance again from the same place or around the same resistance, the same 2 resistants are called double top. You will understand by looking at the chart. If you do not know about support and resistance then 👉click here

Now you must be thinking that the double top chart pattern is fine but how to trade in it, then for that
I want you to try yourself and anyway if you look at the chart carefully, you will know where to put entry, stop loss, and target.
Head and Shoulders
In A chart pattern: A chart pattern is formed when the market gives signals to move down after closing the trade.
In a pattern, the price of the stock is taken resistant from one place and then after some time it gives fake breakout from the same resistant and then after some time again takes resistance from around the same resistance, the same 2 resistants is called Shoulders Hey and the one who gives fake breakout is called Head. You will understand by looking at the chart.

Now you must be thinking that the Head and Shoulders chart pattern is fine, but how to trade in it, then one has to look carefully for it.
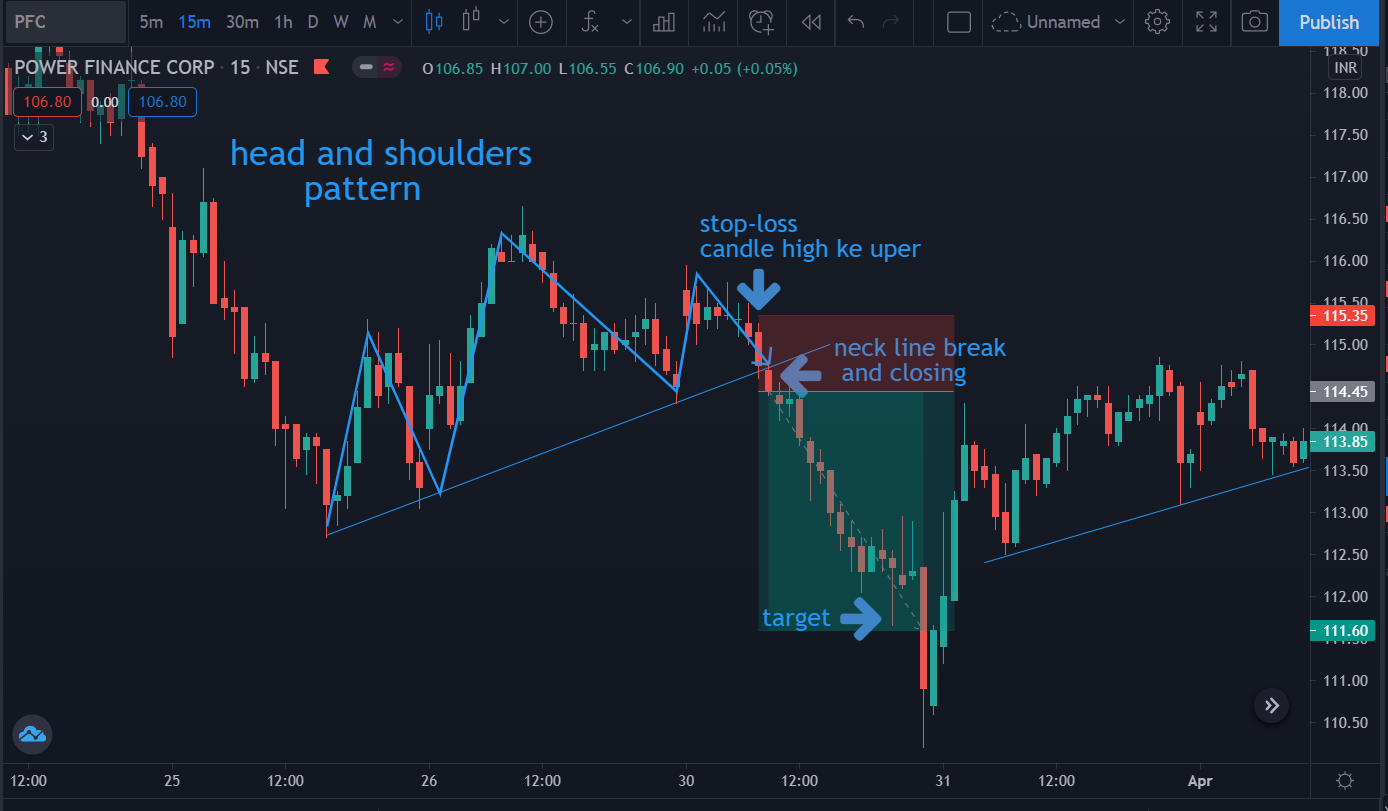
The line below is called the neckline and in this chart pattern, trade is to be done only after doing the neckline course, and closing the candle is necessary only then you can enter the trade.
Inverted Head and Shoulders
A chart pattern with A is formed in A chart pattern when the market shows signs of going down after ending the downtrend.
In a pattern, the stock price takes support from one place and then after some time gives a fake breakdown from the same support and then after some time again takes support from around the same support, the same 2 supports are called Shoulders. Hey and the one who gives fake breakdown is called Head. You will understand by looking at the chart.

Now you must be thinking that the Inverted Head and Shoulders chart pattern is fine, but how to trade in this, I want you to try it yourself, and anyway, if you look at the chart carefully, then you will understand that where is the entry, stop loss and target. Have to put
Flag and Pole
A chart pattern with A is formed in A chart pattern when the market signals an uptrend after ending the downtrend.
In a pattern, the stock price takes resistance from one place and then for some time gives a breakout upwards by taking it as a flag resistant. You will understand by looking at the chart.

Now you must be thinking that the Flag and Pole chart pattern is fine, but how to trade in it, then one has to look carefully for it.

In this chart pattern, trade is to be done only after doing the flag line course and it is necessary to close the candle only then can you enter the trade.
Inverted Flag and Pole
In A chart pattern: A chart pattern is formed when the market shows signs of going down after closing the trade.
In a pattern, the stock price takes support from one place and then breaks down for some time by taking support like a flag. You will understand by looking at the chart.
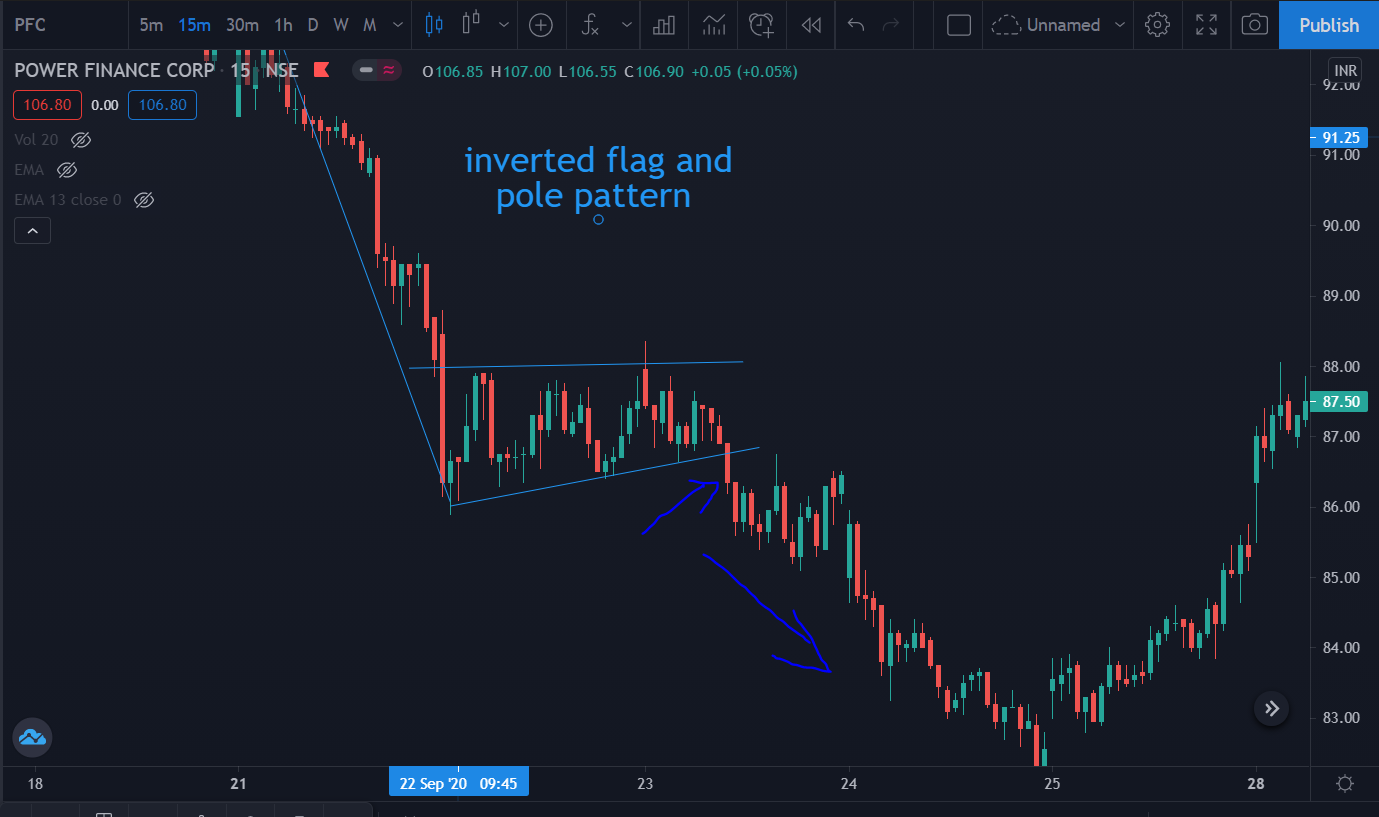
In this chart pattern, it is necessary to trade only after doing the flag line course and it is necessary to close the candle only then you can enter the trade. Now you must be thinking that the Inverted Flag and Pole chart pattern are fine but trade in this How to do it, I want you to try it yourself and anyway if you look at the chart carefully, you will know where to put it entry, stop loss and target.
And there are many chart patterns that I will share with you slowly through the blog. If you like the blog then don't forget to follow.
Comments
Post a Comment